Why Your Audio Waveform Image Looks Flat, and How to Fix It
A waveform image draws the loudest sample per bar. Why a quiet file looks flat, why a drum-heavy one stays spiky, and what normalising does and does not fix.
Drop a quiet podcast recording into a waveform generator and the picture is a thin line along the bottom. Drop in a track with loud drums and the picture is a comb of spikes with nothing between them. Neither image is a bug. Each one is an honest drawing of one number per bar, and the number is not the one most people expect.
What one bar is
A waveform image has a few thousand bars, and an audio file has millions of samples, so each bar stands for a slice of the file. The common choice is the loudest sample in the slice. Audacity's manual describes it this way: the dark part of its waveform displays "the tallest peak in the area that pixel represents"2. The BBC's waveform-data library keeps the same idea as arrays of maximum and minimum sample values3.
The Audio Waveform Generator works the same way. It decodes the file, cuts it into 2,048 slices, and takes the largest absolute sample across all channels in each. Bar height is that value times the image height, so a sample of 1.0, full scale, reaches the top and a sample of 0.1 reaches a tenth of the way up. The tool does not rescale to the file's own loudest sample.
A short loud event inside a slice sets the whole bar. At 2,048 bars a 4-minute track gives slices of about 117 milliseconds, and a one-hour file gives slices of about 1.8 seconds. A single click inside such a slice looks the same as 1.8 seconds of sustained sound.
Why a quiet file looks flat
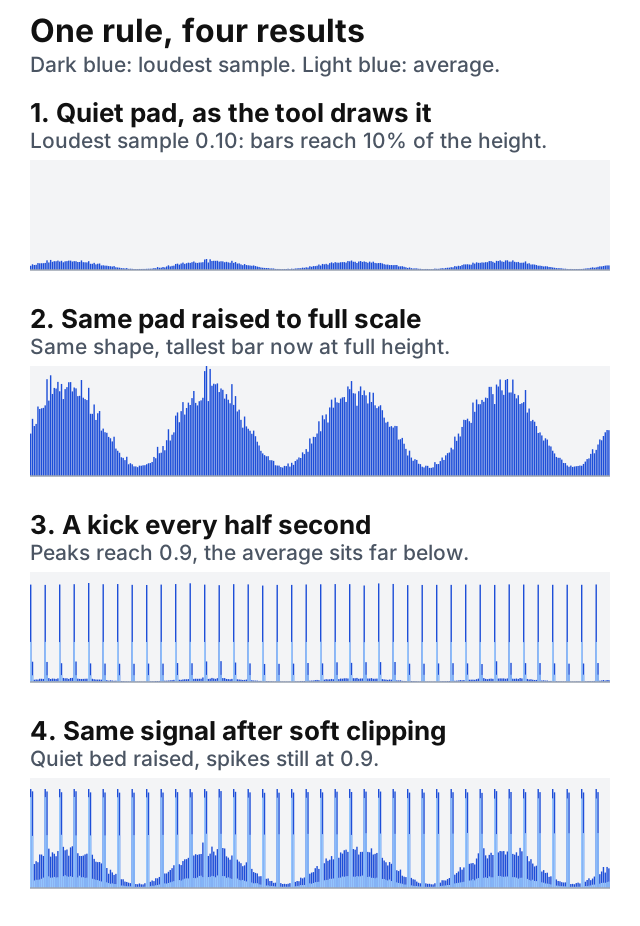
Take a synthetic test signal: 20 seconds of slowly swelling noise, a stand-in for a quiet pad, with its loudest sample set to 0.10, about -20 dB below full scale. Run the tool's slicing rule on it and the tallest bar reaches 10% of the image height. The median bar sits at 3.7%.
Multiply every sample by 10 so the loudest one reaches 1.0, which is all that peak normalising does, and the same signal's tallest bar reaches 100% and its median bar 36.7%. The shape did not change. Only the scale did.
So for a quiet recording the fix is to raise the level first, in any audio editor, and then draw it.
Why a loud file can stay spiky
The second synthetic signal has a kick drum every half second: a 60 Hz tone that dies away with a time constant of 35 milliseconds, peaking at 0.9, over a bed of noise at about 0.04. Its peak-to-average ratio, the crest factor, is 16.8 dB. Drawn with the tool's rule, 123 of 2,048 bars are taller than half the image, about three per kick, and the median bar is 2.1% tall.
Normalising this one does almost nothing. Its loudest sample is already 0.9, so the factor is about 1.11, and the median bar moves from 2.1% to 2.3%. The picture is accurate: between the kicks the signal really is quiet.
| Signal | Crest factor | Median bar |
|---|---|---|
| Quiet pad, loudest sample 0.10 | 16.1 dB | 3.7% |
| Quiet pad, raised to 1.0 | 16.1 dB | 36.7% |
| Kick over quiet bed, loudest sample 0.90 | 16.8 dB | 2.1% |
| Kick over quiet bed, raised to 1.0 | 16.8 dB | 2.3% |
| Kick over quiet bed, soft clipped, loudest sample 0.90 | 8.4 dB | 22.3% |
The last row shows what does change the picture. A soft clip, here a plain hyperbolic tangent with the result scaled back to a peak of 0.9, squeezes the loud hits toward the level of the bed. The crest factor drops to 8.4 dB and the median bar to 22.3%. A real compressor or limiter gets there with attack and release times instead of clipping the waveform. What matters for a waveform image is only that the loud hits shrink toward the level of everything else.
Peak against average
Between the kicks, the average level says what the file sounds like, and the loudest sample does not. Audacity draws both: dark blue for the peak and, over it, a lighter shade for the average RMS value of the same samples2. The manual calls the light part "a rough guide to how loud this area might sound"2. In panel 3 of the figure the light blue stays near the floor between kicks while the dark blue reaches the top at every kick.
The browser tool draws peaks only. If you need the average level shown, draw it in Audacity, or take a peak image and accept that it shows the loudest events, not the loudness.
Long files cost memory before they cost time
Before any bar is drawn the browser decodes the entire file. The Web Audio specification stores each channel of a decoded buffer as 32-bit floating-point values, and decodeAudioData resamples to the sample rate of the audio context1. The size follows from the arithmetic: seconds times sample rate times channels times 4 bytes.
| Audio | Decoded size |
|---|---|
| 4 minutes, 44.1 kHz stereo | 85 MB |
| 1 hour, 44.1 kHz mono | 635 MB |
| 1 hour, 44.1 kHz stereo | 1.27 GB |
| 1 hour, 48 kHz stereo | 1.38 GB |
| 218 minutes, 44.1 kHz stereo (a 128 kbit/s MP3 of 200 MB) | 4.6 GB |
The compressed file size says little about this. The tool accepts files up to 200 MB, and a 128 kbit/s MP3 of that size runs 218 minutes. The arithmetic puts its decoded form at 4.6 GB. This was not run to find where a given browser gives up, so treat the table as the amount the decoder has to produce, not as a promise about any device. The spec itself recommends streaming for long sounds1, and this tool decodes the file in one piece, so trimming first is the practical answer.
What to do
For a quiet recording, raise its level in an audio editor, then draw it. For a spiky track, decide whether the spikes are the picture you want. If they are, leave it. If you want a fuller shape, compress or limit it first. For a long recording, cut out the section you want with the Audio Trimmer before drawing, and convert unusual formats with the Audio Converter if the browser cannot decode them. For the audio track of a video, take it out with the Extract Audio from Video and use the result.
Sources
Every number in this article traces to a source below. Where a claim could not be sourced, it was cut rather than softened.
- Primary sourceW3C
That an AudioBuffer holds each channel as 32-bit floating-point linear PCM, that decodeAudioData resamples the decoded audio to the sample rate of the audio context, and that the specification advises streaming for longer sounds such as music soundtracks.
- Primary sourceAudacity Team
That the dark part of Audacity's waveform shows the tallest peak in the area a pixel represents, that the light part shows the average RMS value for the same samples, that the default scale is linear from -1.0 to +1.0 with a logarithmic dB view available, and that a taller waveform means louder audio.
- Primary sourceBBC
That waveform-data is a BBC library for working with audio waveform data, and that its examples draw the upper half of the waveform from maximum sample values and the lower half from minimum values.
Topics
- Waveform
- Audio
- Peak
- Rms
- Normalize
Tools mentioned in this article
- Audio Waveform Generator - Generate a SoundCloud-style waveform image from any audio file. Decoded in your browser, exported as PNG or SVG.